
One major thing that I learned throughout the years is the power of debugging. Irrespective of the programming language I use, debugging is for me key when it comes to understanding the functionality of code (also for code written by someone else). One of the very first steps when digging into a new coding basis is always turning the debugging mode on - it guides you so nicely through the functions that were written (and that show you how they are connected) 😊
As a fun fact, when I wrote the initial version of my first R package, I wasn’t aware of how debugging works in R and I used a lot of print() statements to understand my functions. And there’s nothing wrong with using print() (or other ways) to understand your function (and is also often the go-to solution for many people 😊)
How frequently do use debugging when working in #rstats?
— Cosima Meyer 🦣 @cosima_meyer@mas.to (@cosima_meyer) September 13, 2022
I think all answers are great! I used to google everything on StackOverflow (SO) before learning how to properly debug 😊
But more on this @WeAreRLadies today 🤗
It works in particular well for smaller functions but once your code universe gets larger, unleashing the power of debugging is a game changer!
💡 So, how do you debug in R?
Three basic commands in RStudio let you do the debugging: debug(function_name), browser(), and undebug(function_name).
With debug(function_name) you start the debugging of your function - it’s basically like a mole that digs in. When you’re in debug mode, you can also call the objects in your function.

Alternative text
GIF showing how a debugger goes through each step of a function after activating it with debug()
If you want your debugger to stop at a certain point, you can manually set your breakpoints in the UI; but I’ve learned that this does not work reliably in RStudio. If you have experience with PyCharm or VS Code, there it works smoothly!). But for RStudio, I always go for the good old browser() call and place it, where I want my function to stop 😊 the downside with browsers is, that you have to make sure to remove them later to have clean and fully working code. And that’s how the browser works in action:

Alternative text
GIF showing how a breakpoint is enforced in the debugging mode using a browser()
Once we’re done with debugging, it’s important to turn the debug mode off - simply with undebug(function_name). Or, if you’re working in a package environment hit devtools::load_all() or the shortcut: Cmd + Shift + L (or on Windows: Ctrl + Shift + L)

Alternative text
GIF showing how to end a debugger using undebug()
While there is also debugonce(), I hardly use it because I usually go back into a function more than once. My typical workflow would then be: debug() > “find error, fix it” in a loop > “Cmd + Shift + L” because I usually work in a package environment.
👩🏼💻 More helpful tools for debugging
Another great tool that you can use to better understand code structures is {flow} by Antoine Fabri - it visualizes a chart diagram of the functional architecture. Let’s take a look at this simple function that calculates the sum:
make_sum <- function(a, b) {
  c <- a + b
  return(c)
}
But what happens under the hood? We can see it here in code language but wouldn’t it be great to see it more visually? Here’s {flow}’s moment to shine! ✨ Run this line of code and you’ll get a flow diagram that shows you how the function works 🥳
install.packages("flow")
library(flow)
flow_run(make_sum(a=2, b=3))

Alternative text
Showing the visualization output of flow. An oval container has the name and the arguments of the function, a rectangular container has the inner core of the function
This looks relatively simple, right? Well, that’s the case because it IS a simple function - but it becomes more and more complex, the larger the function gets and the more sub-functions it has. Just try it out yourself with one of your favorite functions 👩💻
If you look for more examples, search on Twitter for the #debuggingflow hashtag that we used when I was curating the R-Ladies' Twitter account 🥳
Thanks Cosima!
— Antoine Fabri (@antoine_fabri) September 13, 2022
.deparseOpts() was my latest use case#debuggingflow #rladies pic.twitter.com/3Fyfnlgy1k
Here's my flow diagram - and I love how it also shows "stopping" points with the orange dots 🤩 This is how the overview_tab function from {overviewR} 📦 looks like #rladies #debuggingflow pic.twitter.com/V5DQh2YMK1
— Cosima Meyer 🦣 @cosima_meyer@mas.to (@cosima_meyer) September 13, 2022
i did not know about this {flow} pkg, thanks pic.twitter.com/N7BhqtFEBw
— Z on mastodon now 🦄🇨🇦🌈 (@StarTrek_Lt) September 13, 2022
If you want more input, Shannon Pileggi put some nice slides on debugging and best practices together and Jenny Bryan gave a a keynote about debugging at the rstudio::conf(2020) 🗒
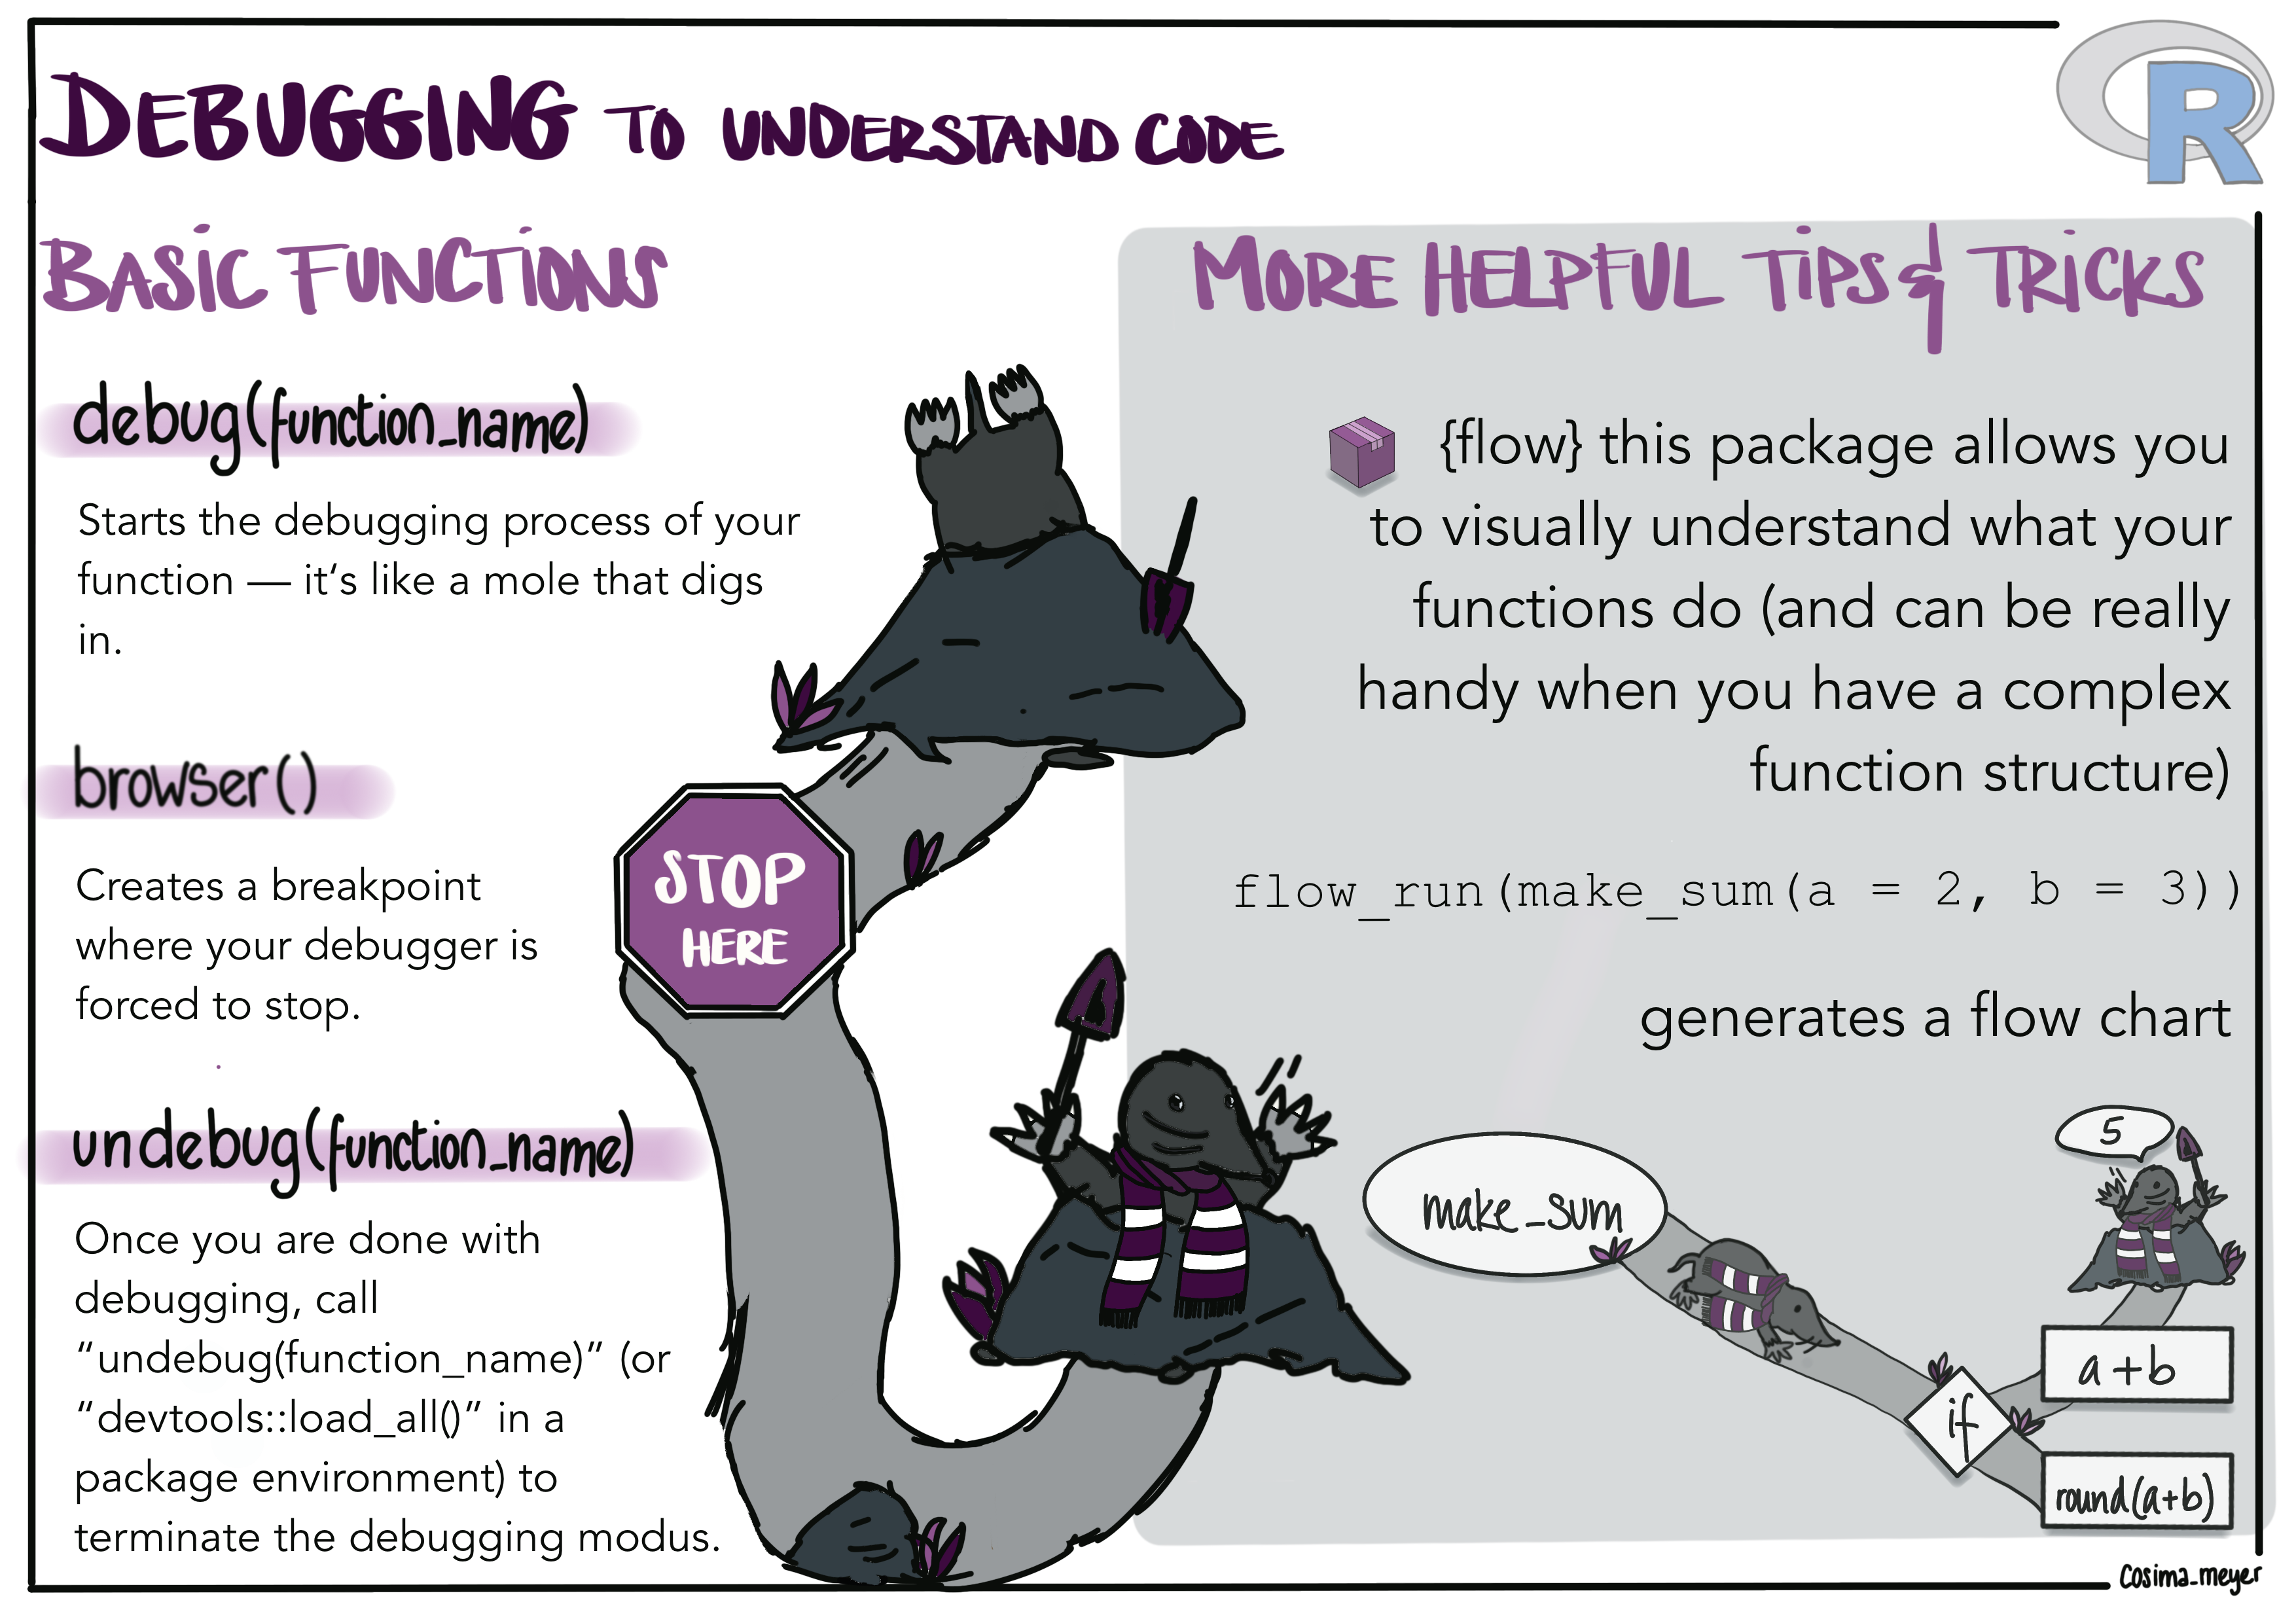
📝 For a summary of how debugging works and how it helps you to understand code, here’s a quick summary with a cute mole 💕 (also as 📄PDF for you to download here):
Alternative text
Image showing a mole as a comparison for the debugging process (a mole digs in using debug(), stops when there is a browser(), and leaves the tunnel when calling undebug(). It also shows how the flow package works by visualizing a flow chart.